Redstar Express Plc
Redstar Express 2008 Q2 Income Statement
Year 2008 2007 Growth
Turnover N2.039b N1.585b 28.64%
PBT N272.0m N211.7m 28.48%
PAT N190.4m N148.2m 28.48%
Selected Indices
Sector Commercial Services
Current Price N3.57
Shares 590 million
Market Cap N2.106 billion
EPS 32K
Projected EPS 65K
PE 5.49
Fair value N13.01
Financial Analysis
I have been following the progress of this company since its listing on the NSE late 2007 and have been able to establish a pattern regarding the year end results they have released so far in one of my earlier analysis. The stock price has been dropping consistently since the onset of the bear run early this year and does not look like easing off. The company is a low capitalization stock with strong earnings since listing, which has ignited my interest in it.
They released their half year results for the period ended 30 September 2008 a few days ago on the floor. The turnover increased by 28.64% from N1.585 billion to N2.039 billion from the corresponding quarter in the last financial year. Profit before tax also increased by almost the same margin, 28.48%, from N211.7 million to N272.0 million while after tax profits grew at the same rate to N190.4 million fro N148.2 million.
For whatever reason, they have not been able to manage their expenses well this quarter, unlike in this past as profit margin, using before tax profits as the numerator to remove tax effects, dropped by 2 basis points from 13.36% to 13.34%. This increase in expenses may not be unconnected with the recent promotions this company has been carrying out.
Valuation
Based on the results the earning per share comes to 32K with an estimated full year earnings of 65K per share. This brings the company’s price earning multiple to 5.49x. It might as well be the cheapest stock on the NSE at the moment and it has an intrinsic value of N13.01.
Technical analysis

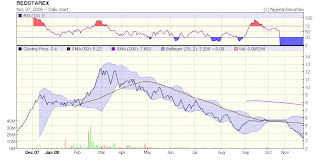
The chart, which was gotten from http://www.nigeriansecurities.com shows that the relative strength of the stock has been weak compared with that of the NSE Index. It has been underperforming the market for 7 months with brief respites in mid February and mid September. The price also shows that it has hit the bottom of the Bollinger band and the distance of the price below the 50 day moving average means that it is becoming oversold. There is a 2.5% chance that the price may fall further as there is no guarantee as to what the market would do and if that happens then we should be prepared for another low. It is also possible for the price to consolidate at this level before moving up. There have been poor trading volumes over the past several months and there doesn’t seem to be any respite in sight. If an upward price moves happens, it is not likely to be sustained unless there are heavier volumes to push it above the break point, which has not started happening, yet.
Conclusion
Fundamentally this stock is selling at a cheap price and it does not matter what the price trends say, it is a very good buy for the short, medium and long term.

